Production troubleshooting in .NET
Rail Sabirov
GitHub: @rsabirov
Who ever had a issues on Production environment?
Why Prod issues so hard to diagnose?
- hard to reproduce on other environments
- can't run intrusive tool
- can't install tools usually
What can go wrong?
- high resource usage (cpu, mem, disk, network)
- app is crashing
- app is hanging
- app is slow
- and many more... :)
Sources of information
- Application log files
- Task manager / Process explorer / Resource monitor
- Windows Events log
- Performance counters
- Sysinternals tools
- Memory dumps
- Event Tracing for Windows (ETW) and Tools that using ETW (PerfView)
- Technology specific tools (like Sql Profiler)
Sysinternals suite
AccessChk, AccessEnum, AdExplorer, AdInsight, AdRestore, Autologon, Autoruns, BgInfo, BlueScreen,
CacheSet, ClockRes, Contig,
Coreinfo, Ctrl2Cap, DebugView, Desktops, Disk2vhd, DiskExt, DiskMon, DiskView, Disk Usage (DU),
EFSDump, FindLinks, Handle,
Hex2dec, Junction, LDMDump, ListDLLs, LiveKd, LoadOrder, LogonSessions, MoveFile, NotMyFault,
NTFSInfo, PageDefrag, PendMoves,
PipeList, PortMon, ProcDump, Process Explorer, Process Monitor, PsExec, PsFile, PsGetSid, PsInfo,
PsKill, PsList, PsLoggedOn,
PsLogList, PsPasswd, PsPing, PsService, PsShutdown, PsSuspend, PsTools, RAMMap, RegDelNull, RegHide,
RegJump, Registry Usage (RU),
SDelete, ShareEnum, ShellRunas, Sigcheck, Streams, Strings, Sync, Sysmon, TCPView, VMMap, VolumeID,
WhoIs, WinObj, ZoomIt
Demo 1: Process Monitor, Process Explorer
Event Tracing for Windows (ETW)
- Technology for application non-intrusive production tracing
- Built into Windows since NT 4
- Doesn't affect performance if disabled
- Minimal performance effect when enabled
- Can drop events if "performance is not enough"
- Used in .NET CLR (provides detailed info about CLR, JIT, GC...)
- All the Windows subsystems instrumented by ETW
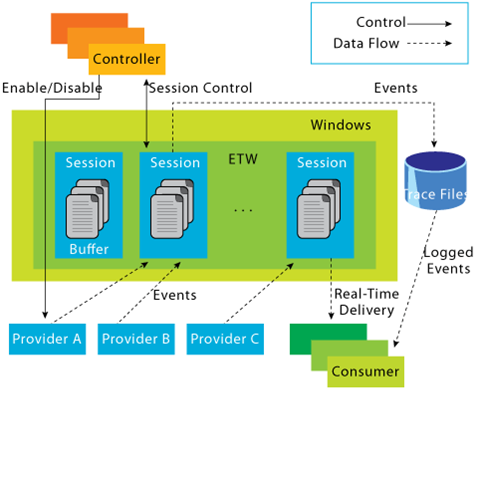
ETW Architecture overview

PerfView tool
Powerful tool to work with ETW
- No installation needed
- Profile CPU usage
- Analyze .NET Memory dumps
- Analyze .NET GC
- Analyze .NET Memory traffic
- Analyze File/Network access
- Trace anything in Windows
Demo 2: PerfView
Memory dump
- Memory dump is a snapshot of running process
- A dump file is static snapshot, but you can use several dump
- Crash dumps are generated when an application crashes
How to get Memory dump?
- Windows Task Manager
- Sysinternals Process Explorer
- Windows Error Reporting
- ProcDump
ProcDump
Write a mini dump when process window is unresponsive for more than 5 seconds:
procdump -h outlook.exe hungwindow.dmp
Write a dump when process has an unhandled exception
procdump -mp -e store.exe
Write a full dump of a process with PID '4572' using cloning (to avoid service
interruptions)
procdump -ma -r 4572
Write a mini dump of a process named 'outlook' when total system CPU usage exceeds 20% for 10
seconds
procdump outlook -p "\Processor(_Total)\% Processor Time" 20
How to analyze Memory dump
- DebugDiag (crash and memory)
- PerfView (memory)
- DotMemory (memory)
- WinDbg (crash and memory)
- clrmd library (memory)
How to analyze Memory dump in WinDbg?
- Open dump file in DebugDiag
- google "WinDbg cheatsheet"
- try to make it work :)
- Profit! (maybe)
- Very powerfull tool
- Try to avoid it
Debugging symbols
- Provides function names for unmanaged code
- Provides call stacks in .NET exceptions with line numbers
- Enables Step into external code during the debugging
Best practices
-
System wide symbol path
_NT_SYMBOL_PATH=SRV*%TEMP%\symbols*http://msdl.microsoft.com/download/symbols - Always include *.pdb files application distribution package